With the new Census numbers out last week, it appeared that Johnson County stands to gain three House seats and one in the Senate given the fact that it attracted more people than any place else in the state during the last decade.
There is a view that a shift of legislative districts to the east could benefit Democrats or moderate Republicans because those new boundaries will be drawn in a county that has had a purplish tinge in recent election cycles.
On this Saturday, we thought we would show you a map that gives you a sense of where the growth patterns are in Johnson County, which may give you a peek at where any new districts might go.
Before the Census numbers came out last Thursday, Johnson County planners used Census estimates from the American Community Survey from 2010 to 2019 to give us an idea of where the growth has been during the last decade.
Those development patterns do not reflect the final Census data that was released last week.
Couple that with numbers crunched by Wichita State political scientist Brian Amos and you can start to get an idea of how new legislative districts could be drawn assuming they follow the county’s growth patterns.
Remember, for the House the optimal population is 23,503 and districts can be no more than 5% above or below that target.
Similarly, the target population for Senate districts is 73,447 and they can be more han than 5% above or below that target.
Refine Amos’ data a little more and it shows that there are 25 House districts that are above the 5% mark and 42 below the 5% threshold.
Of the 10 House districts that are above the 5% mark, five of them cover parts of Johnson County and are generally located south of the Interstate 435 loop, which tends to be more conservative.
In the Senate, there are eight districts above 5% and 13 below 5%. Nineteen districts fall within the plus or minus range of 5%.
Of the eight above 5% in the Senate, three cover some part of Johnson County.
In the House, Republican Rep. Sean Tarwarter’s 27th District is almost 40% above the targeted population.
The 121st District of Republican Rep. John Resman of Olathe is 34% over, Republican Rep. Adam Thomas’ District 26 is 26% over and Republican Rep. Charlotte Esau’s District 14 is about 23% over.
Republican Rep. Chris Croft’s 8th District is 17% over the targeted population.
On the Senate side, Republican Molly Baumgardner’s District 37 is about 20% over the targeted population.
The 21st Senate District represented by Democrat Dinah Sykes of Lenexa is about 9% over the targeted population and Republican Beverly Gossage’s District 9 is about 13% over the targeted population.
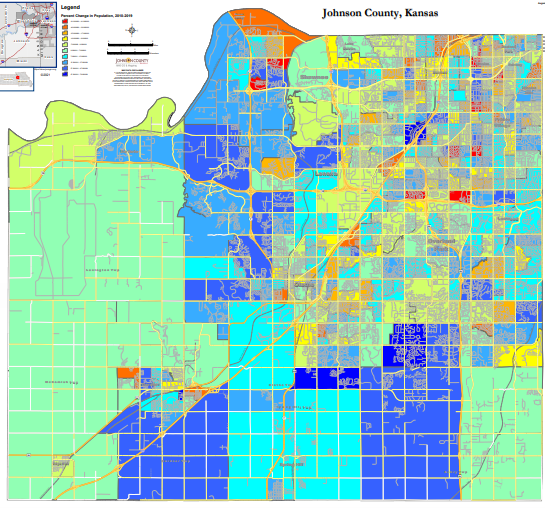
Here is the map showing Johnson County’s growth patterns by percentage.
The dark blue areas represent the highest percentages of growth while red, orange and yellow represent percentage declines.
The lighter shades – blue, aqua and green – are growth areas, but to a lesser extent than dark shaded blue areas. Here’s a link to a map you might see better.
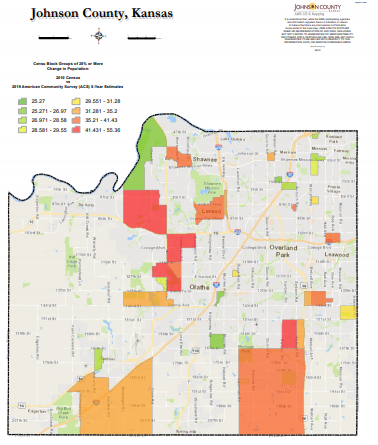
The following map shows the areas of the county with the hottest spots for growth, namely census blocks with 25% or more growth.
Shades of green ranged from 25.3% to 28.58% growth. Red represents a growth range from 41.4% to 55%. Orange ranges from 35.2% to 41.4%.